Projected climate change in Finland during the 21st century calculated from CMIP6 model simulations

Geophysica Vol. 56, Nos. 1–2, 2021

Abstract

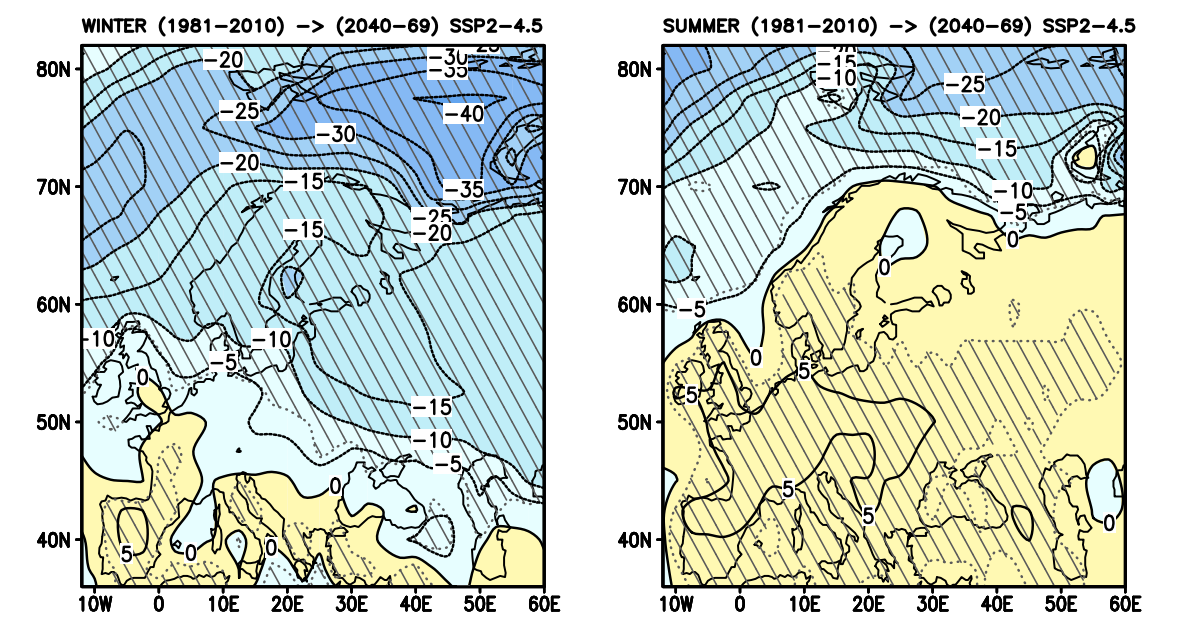
Climate scenarios for Finland were updated to correspond the Shared Socioeconomic Pathway (SSP) greenhouse gas (GHG) scenarios, considering nearly 30 global climate models (GCMs) that participated in Phase 6 of the Coupled Model Intercomparison Project (CMIP6). The SSPs and CMIP6 GCMs had also been used by the Intergovernmental Panel on Climate Change (IPCC) in composing the Sixth Assessment Report, published in 2021. Projections are provided for three future 30-year periods and all four SSP scenarios from which enough GCM data were available. The signs and geographical patterns of the projected changes are mostly similar to those derived from the previous model generation, the amplitude of the changes depending on the GHG scenario. For example, by the period 2040–2069 under SSP2-4.5, mean temperatures are projected to increase in Finland by 2.4 (1.0–3.8) ◦C in summer and 3.3 (1.2–5.4) ◦C in winter (the multi-model mean change relative to 1981–2010 and, in parentheses, the 90 % uncertainty interval reflecting inter-model differences). Compared to the projections calculated from the previous model generations using comparable GHG scenarios (RCP4.5 or SRES B1), warming is fairly similar in winter but stronger in summer. The diurnal range of temperature is projected to be reduced in the cold season. Precipitation increases by 5 (−6 to 17) % in summer and 12 (0 to 24) % in winter, in good concordance with the previous projections. In summer, the sign of change is fairly uncertain, particularly in southern Finland. Estimates for seasonal incident solar radiation change have become brighter by 1–4 percentage points. For air pressure and wind speed, the multi-model mean changes are close to zero butinter-model spread is sizeable.

Wind-generated long wave climate in the Tvärminne area

Geophysica Vol. 56, Nos. 1–2, 2021

Abstract

Several studies have shown that the wave climate in the archipelago sheltering the Finnish coast varies much within short distances. During the years 2011–2015 The Finnish Transport and Communications Agency (Traficom) financed a wave modelling project to establish navigational rules for ships operating in sheltered waters. The data of that project is used here to produce a map of the area surrounding the Tvarminne Zoological Station about the significant wave height of long waves that is exceeded 10 % of the ¨ time when the sea is not ice covered. The map provides useful information that can be used as a proxy for the current velocities near the bottom

Mapping topographic, geophysical and gravimetry data of Pakistan – a contribution to geological understanding of Sulaiman Fold Belt and Muslim Bagh Ophiolite Complex

Geophysica Vol. 56, Nos. 1–2, 2021

Abstract

Along with the development of the scripting technology in cartography, such as the Generic Mapping Tools (GMT) and libraries of R programming language, geologic and geophysical mapping is being vigorously promoted, where the integration of the thematic data, such as GEBCO/SRTM, EGM-2008 and open geological raster and vector layers is one of the primary datasets that provides the highresolution raw sources for cartographic visualization in the geologically complex regions like Pakistan. This study aims to integrate scripting methods of automated cartography, methods of applied geoinformatics for geomorphometric analysis and technical data processing (formatting, projecting, plotting), to provide a synthesis of the geological, geophysical and geomorphological maps of Pakistan they as new information supporting analysis of the geospatial variations of geology, geomorphology, tectonics and gravity fields with a special focus on the geologically remarkable region of Pakistan: Sulaiman Fold Belt and Muslim Bagh ophiolite complex. This study presents new 12 thematic maps, which are technically made using scripting approaches and open tools. All maps cover the region of Pakistan and they are made using open source tools: GMT, R and QGIS. A GMT and R based scripting mapping is applied for mapping Pakistan, and its algorithm steps are presented stepwise as code snippets. A system complex approach of the data integration and formats reshaping, data conversion and reformatting for a single project of the geology of Pakistan is designed and developed based on the combination of the programming and scripting techniques and with additional QGIS based mapping, which effectively integrates the thematic geospatial multi-origin datasets. Various color palettes and cartographic visualization approaches have been used to achieve the best visualization. The resulting maps are explained and discussed. Correlation between spatial phenomena of Earth’s gravity, geologic evolution and tectonic movements were pointed out and commented on. New 12 maps present the regional geologic setting of the country.

Welcome to the new Geophysica website. Articles published before 2019 are temporarily accessible only through our archived old site.